 Geobru catalogue
GML
Type of resources
Available actions
Topics
INSPIRE themes
Keywords
Contact for the resource
Provided by
Years
Formats
Representation types
Update frequencies
status
Service types
Scale
Resolution
-
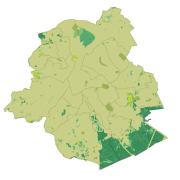
This dataset corresponds to the vegetation cover in the Brussels Capital Region. It is made of two raster images : vegetation 2021, and vegetation 2023.
-
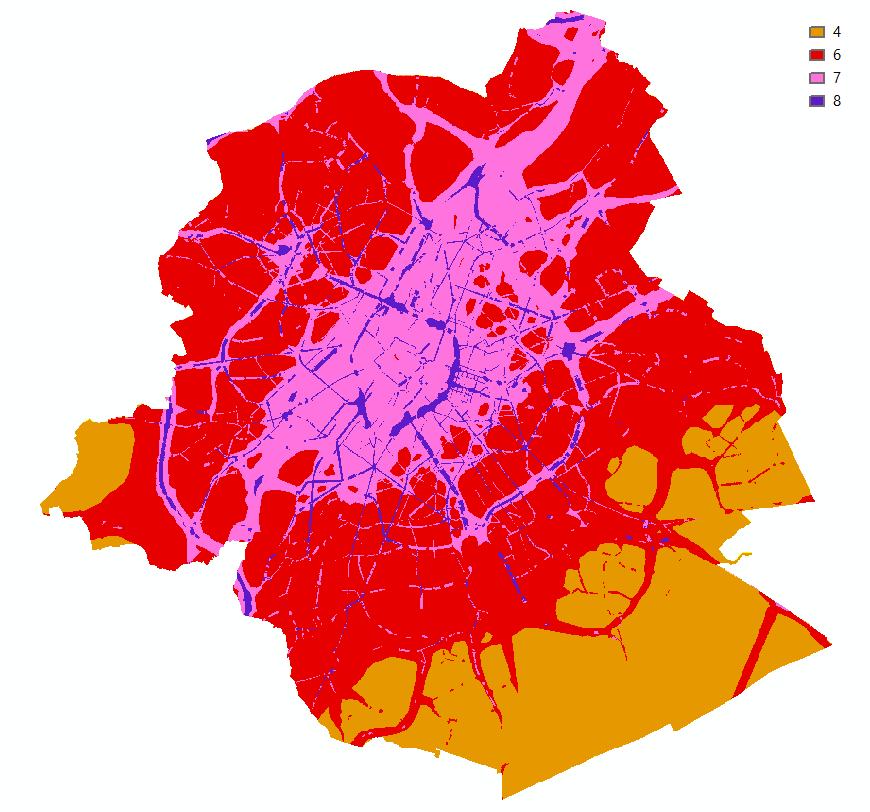
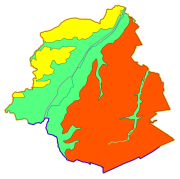
Brussels-Capital Region : This map shows the Health Impact Screening score for air quality (0-8) in the Brussels Capital Region. It was produced as part of the 2020 study on the "Impact of 'Nature-Based Solutions' (NBS) on urban residents' exposure to air pollution, noise pollution or high temperatures - Overview of general knowledge and recommendations for the Brussels-Capital Region". This map is based on the 2018 annual average nitrogen dioxide concentration map. For the methodology used, see p.49. The study report (in dutch) is available at http://document.environnement.brussels/opac_css/elecfile/NatureBasedSolutions
-
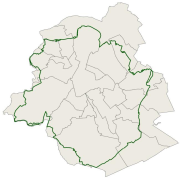
This dataset corresponds to the greenway. It is made of one geometric classe : the greenway.
-
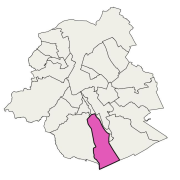
This dataset corresponds to the nitrate-vulnerable zone in accordance with the prescriptions of the European Directive 91/676/EEC, by the Ministerial Order of 25 May 1999. It is made of one geometric classe : the nitrate-vulnerable zone.
-

This dataset corresponds to the areas with a lack of green spaces accessible to the public in the Brussels-Capital Region, in accordance with the objectives of the Regional Nature Plan 2016-2024. It is made of one geometric classes : Areas with a lack of green spaces accessible to the public
-
This dataset corresponds to the trees managed by Brussels Environment. It is made of one geometric classe : trees managed by Brussels Environment.
-
This service allows downloading the datasets (compliant with the data specifications of INSPIRE) from the INSPIRE theme "Natural risk zones" of the Brussels-Capital Region of Brussels Environment.
-
Brussels-Capital Region : data on the 5 Groundwaterbody of the Area of Brussels, defined under the Directive and the Ordinance Water : code European, code of Brussels and name of the water mass, hydrographic district
-

Cadastral Parcels - INSPIRE corresponds to the dataset of Belgian plan cadastral parcels complying with INSPIRE specifications. This dataset is composed of two classes. The first class contains cadastral zoning and the second class contains cadastral parcel. The entire dataset can be downloaded via the ad hoc WFS.
-
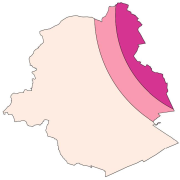
Brussels-Capital Region: location of the three aircraft noise restriction zones defined by the order of the Government of the Brussels-Capital Region of 27 May 1999 on the fight against the noise generated by air traffic.