 Geobru catalogue
1000
Type of resources
Available actions
Topics
INSPIRE themes
Keywords
Contact for the resource
Provided by
Years
Formats
Representation types
Update frequencies
status
Scale
-
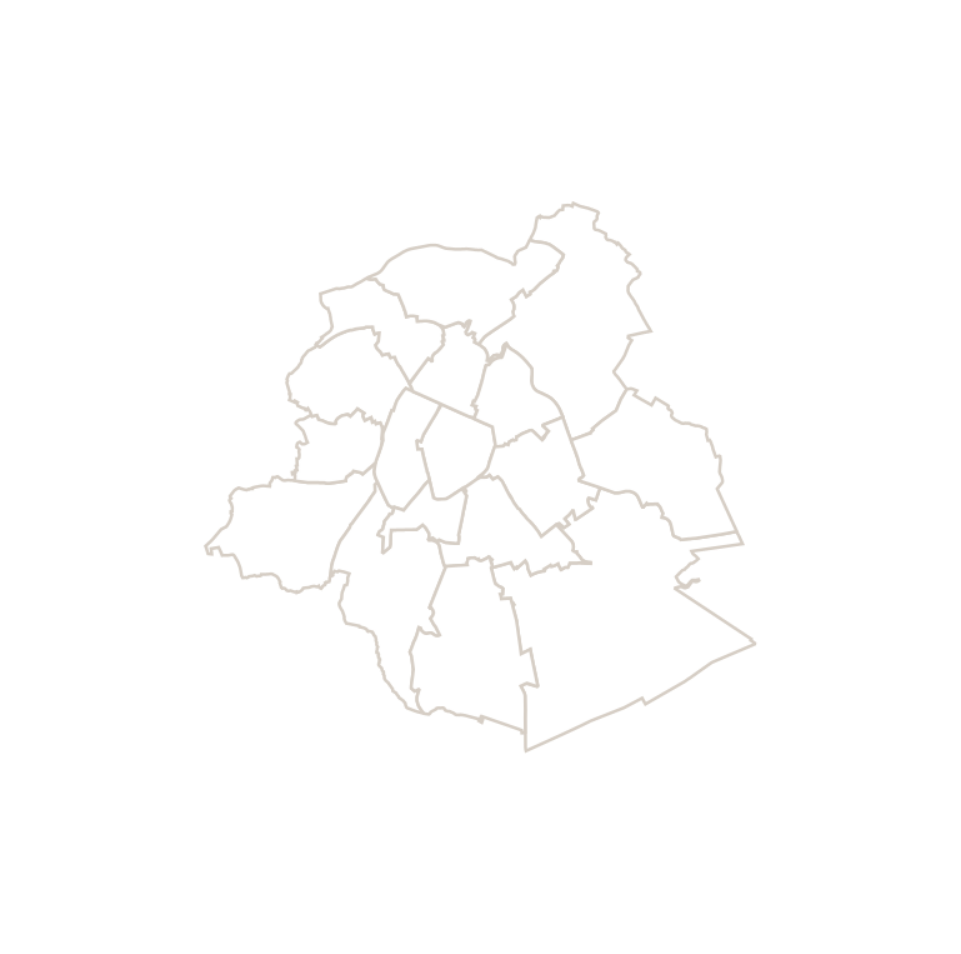
This dataset corresponds to the macrozone dataset, i.e. the highest-level statistical partition of the Brussels-Capital Region (the Region is divided into 17 macrozones).
-

This dataset corresponds to routes and stops of the STIB/MIVB Network (Tramway-Metro).
-
This dataset contains data on addresses in the Brussels-Capital Region. An address point is the graphical representation of one or more house numbers located within buildings or on parcels.
-
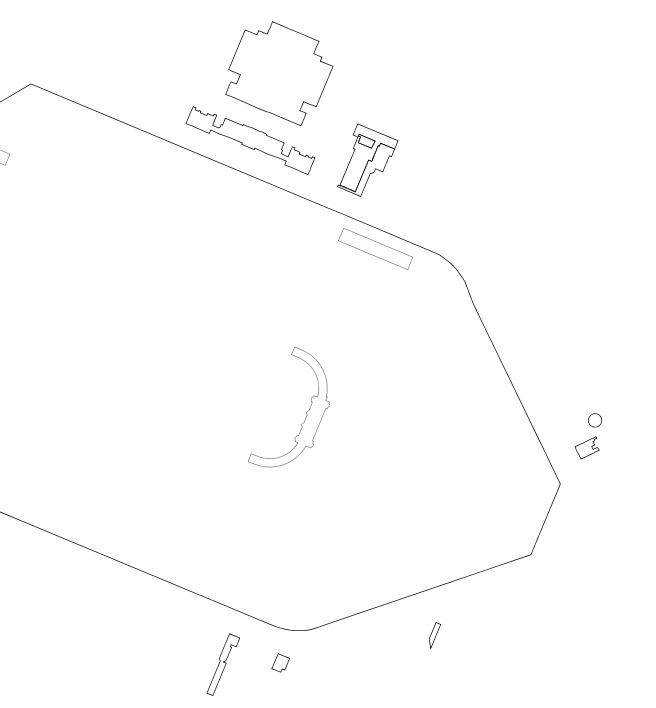
This dataset includes "any particularly remarquable building, including installations or decorative elements being a constitutive part of it" having been the subject of a decree for its conservation in the Brussels-Capital Region.
-

This dataset corresponds to the mesh delimiting the boxes (also called grids) used in UrbIS. The mesh covers the entire territory of the Brussels-Capital Region, and the boxes are one kilometer on each side.
-

This dataset corresponds to the routes and stops of the STIB/MIVB network (Bus).
-

Cadastral Parcels - INSPIRE corresponds to the dataset of Belgian plan cadastral parcels complying with INSPIRE specifications. This dataset is composed of two classes. The first class contains cadastral zoning and the second class contains cadastral parcel. The entire dataset can be downloaded via the ad hoc WFS.
-
This dataset corresponds to the urban renewal area (URA). This zone brings together disadvantaged neighborhoods where the public sector increases its investments. This zone was designated by the Brussels-Capital Region with the aim of improving residents’ quality of life and socio-economic integration, and of creating a new dynamic for the development of the local economy. A first zone was defined in 2016. The boundaries were revised in 2019 and 2026, and this new URA has been in effect since September 2026.
-
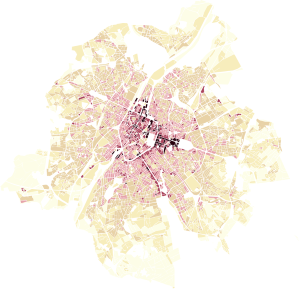
This dataset represents the built density of urban blocks within the territory of the Brussels-Capital Region. It provides four indicators: the floor space index (FSI), the ground space index (GSI), the average number of storeys, and the maximum building height.
-
This dataset contains Inland Electronic Navigational Charts (IENCs), which include all navigation information for the Brussels port area. The three available charts (8B7BRU02, 8B7BRU03, and 8B7BRU05) cover the Brussels section of the Charleroi–Brussels Canal and the Brussels–Escaut Maritime Canal. Together, these two canals form a waterway corridor known as the ABC axis, linking Antwerp with Brussels and Charleroi. This north–south corridor connects major seaports with industrial centres and plays a key role in logistics and modal shift. The data are freely available for download as ZIP archives.