Esri Shapefile
Type of resources
Available actions
Topics
INSPIRE themes
Keywords
Contact for the resource
Provided by
Years
Formats
Representation types
Update frequencies
status
Scale
-
Cadastral parcels - monthly situation corresponds to the dataset of the monthly situation of the cadastral parcels layer from the Land Register plan. The dataset is composed of two classes. The first class contains the geometries of the cadastral parcels; the second is a class without geometry and corresponds to a code table of the different fiscal situations used in the first class. The dataset can be freely downloaded as a zipped shapefiles.
-
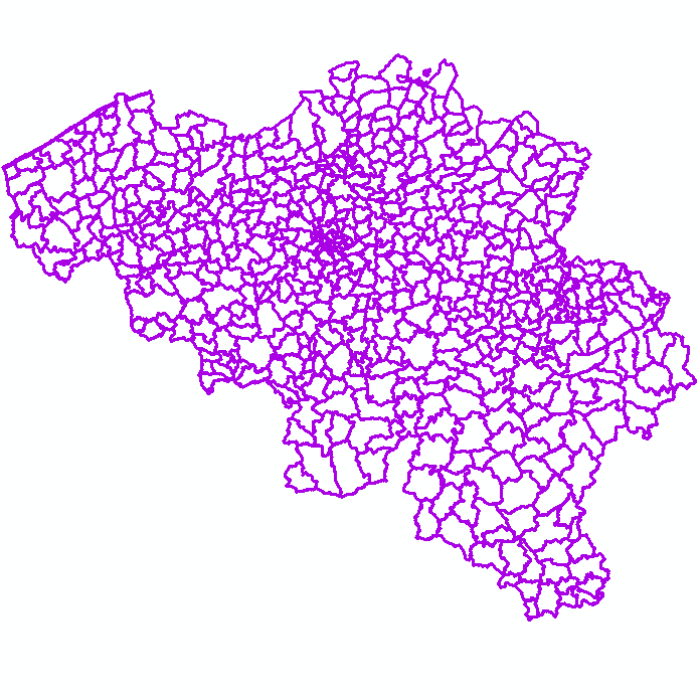
Administrative units - situation on January 1st corresponds to the dataset of administrative units from the reference database for the land register data. Administrative limits are legally defined by an administrative entity or between two administrative entities. In Belgium, administrative limits as legally defined are fixed and can only be changed by a law, ordinance or decree. The General Administration of Patrimonial Documentation of the FPS Finance is named by the federal authorities as the authentic source of Belgian administrative limits. This dataset corresponds to the legal situation as defined on January 1st of the reference year. It is composed of seven geometric classes (polygons and lines) and one class without geometry. The first class corresponds to the whole national territory. The second corresponds to the territory of the three regions, the third to the territory of the provinces, the fourth to the territory of the administrative districts, the fifth to the territory of the municipalities, the sixth to the territory of the Antwerp city districts and the seventh to the administrative boundaries in the form of lines. The class without geometry corresponds to the table of tax situations. The dataset can be freely downloaded as a zipped shapefiles.
-
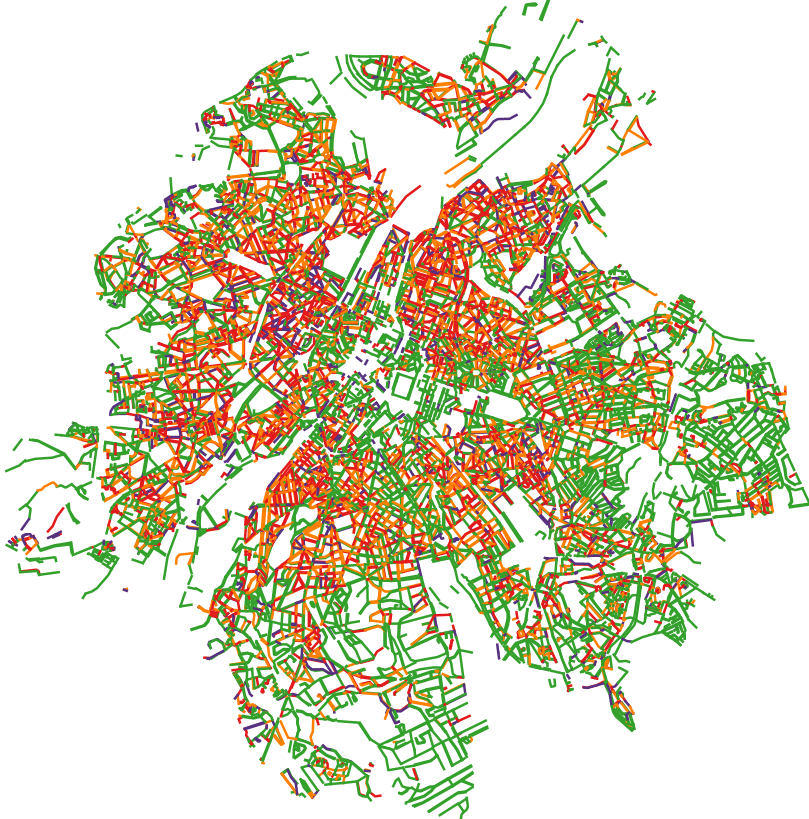
This dataset corresponds to the total occupancy rate of parking demand in 2014 by the different modes of transport (cars and vans, motorised two-wheelers, lorries, other) on all the roads in the Brussels-Capital Region.
-
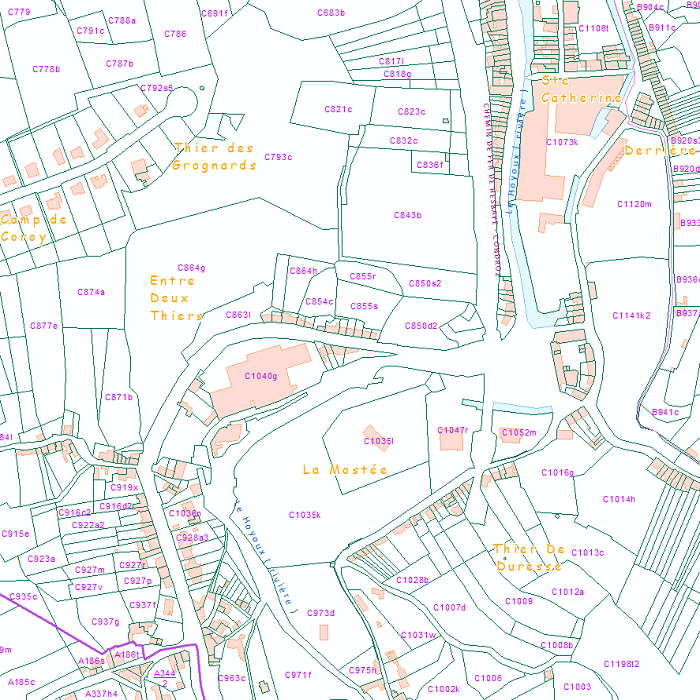
Land register plan - situation on January 1st corresponds to the dataset of land register from the reference database for the land register data CadGIS. The land register plan is one of the elements that make up the patrimonial documentation. It is defined as “the graphic representation and assembling on a plan of all the cadastral plan parcels of the Belgian territory”. A plan parcel, such as defined in Article 2 of the Royal Decree of 30 July 2018, is a part of Belgian territory, geographically delimited and identified by the General Administration of Patrimonial Documentation on the land register plan, which corresponds to the ground surface area of one or more patrimonial cadastral parcel(s) (real estate property as mentioned in Article 472 of the 1992 Income Tax Code in respect of which the cadastral income is fixed). This dataset corresponds to the legal situation as defined on 1 January of the reference year. It is composed of thirteen geometric classes and one class without geometry. The first class includes the cadastral plan parcels present in the corresponding administrative unit. The second class includes the buildings managed by the General Administration of Patrimonial Documentation, the third class includes the buildings managed by the regions, the fourth class includes equipment and tools, the fifth class includes water bodies, the sixth class includes cadastral blocks, the seventh, easements and paths, the eighth, toponymic lines, the ninth, toponymic points, the tenth, property boundaries, the eleventh, parcel numbers, the twelfth, cadastral divisions, and finally, the thirteenth, cadastral limits. The class without geometry corresponds to the table of tax situations. The dataset can be freely downloaded as a zipped shapefiles.
-

Administrative units - current situation corresponds to the dataset of administrative units from the reference database for the land register data. Administrative limits are legally defined by an administrative entity or between two administrative entities. In Belgium, administrative limits as legally defined are fixed and can only be changed by a law, ordinance or decree. The General Administration of Patrimonial Documentation of the FPS Finance is named by the federal authorities as the authentic source of Belgian administrative limits. This dataset corresponds to the current situation at the time of consultation. It is composed of five geometric classes. The first class corresponds to the whole national territory. The second corresponds to the territory of the three regions, the third to the territory of the provinces, the fourth to the territory of the administrative districts, the fifth to the territory of the municipalities. The dataset is freely downloadable via the ad hoc WFS service.
-

Land register plan - current situation corresponds to the dataset of land register from the reference database for the land register data CadGIS. The land register plan is one of the elements that make up the patrimonial documentation. It is defined as “the graphic representation and assembling on a plan of all the cadastral plan parcels of the Belgian territory”. A plan parcel, such as defined in Article 2 of the Royal Decree of 30 July 2018, is a part of Belgian territory, geographically delimited and identified by the General Administration of Patrimonial Documentation on the land register plan, which corresponds to the ground surface area of one or more patrimonial cadastral parcel(s) (real estate property as mentioned in Article 472 of the 1992 Income Tax Code in respect of which the cadastral income is fixed). This dataset corresponds to the current situation at the time of consultation. It is composed of fourteen geometric layers. The first five are the administrative units, namely the country, the regions, the provinces, the districts and the municipalities. The sixth and seventh layers correspond to the cadastral units, divisions and sections. the eighth layer includes the cadastral blocks, the ninth, the property stones, the tenth, the addresses, the eleventh, the polders and wateringues, the twelfth, the cadastral plan parcels, the thirteenth the buildings managed by the AGDP, and the fourteenth, buildings managed by the regions. The dataset is freely downloadable via the ad hoc WFS.
-
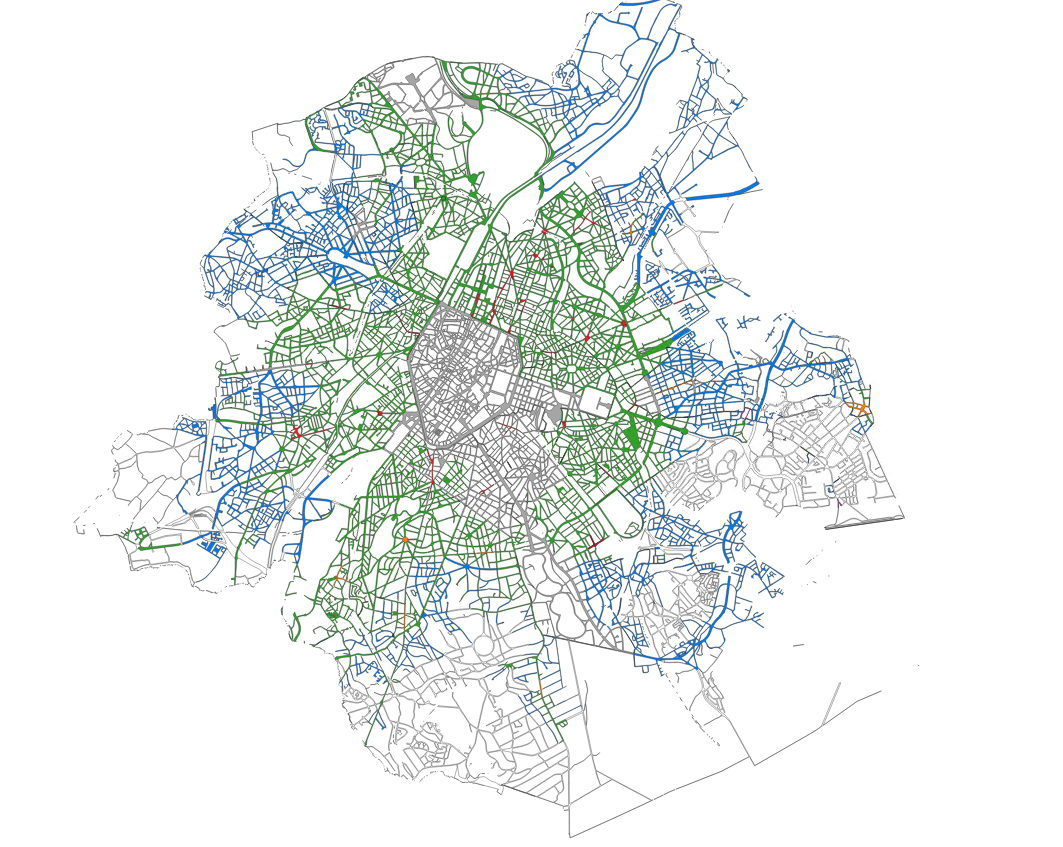
The dataset provides information on the tariff regulations that apply to street parking in the municipalities of the Brussels-Capital Region. It includes details on the spatial coverage and the time-specific application, as well as information on parking durations and fees.
-

This dataset corresponds to the total occupancy rate of parking demand in 2023 by the different modes of transport (cars and vans, motorised two-wheelers, lorries, other) on all the roads in the Brussels-Capital Region. This total occupancy rate is calculated on the basis of 4 time slots: - Tuesday or Thursday from 5.00 am to 7.00 am - Tuesday or Thursday from 10.00 am to 12.00 am - Tuesday or Thursday from 8.00 pm to 10.00 pm - Saturday between 10.00 am and 6.00 pm For each time slot, details of parking demand categorised by mode of transport are available.
-

The "UrbIS - Contour lines" product represents the elevation of the Brussels region by means of contour lines with intervals of 0.5 metres. The dataset is freely downloadable as a zipped file.
-
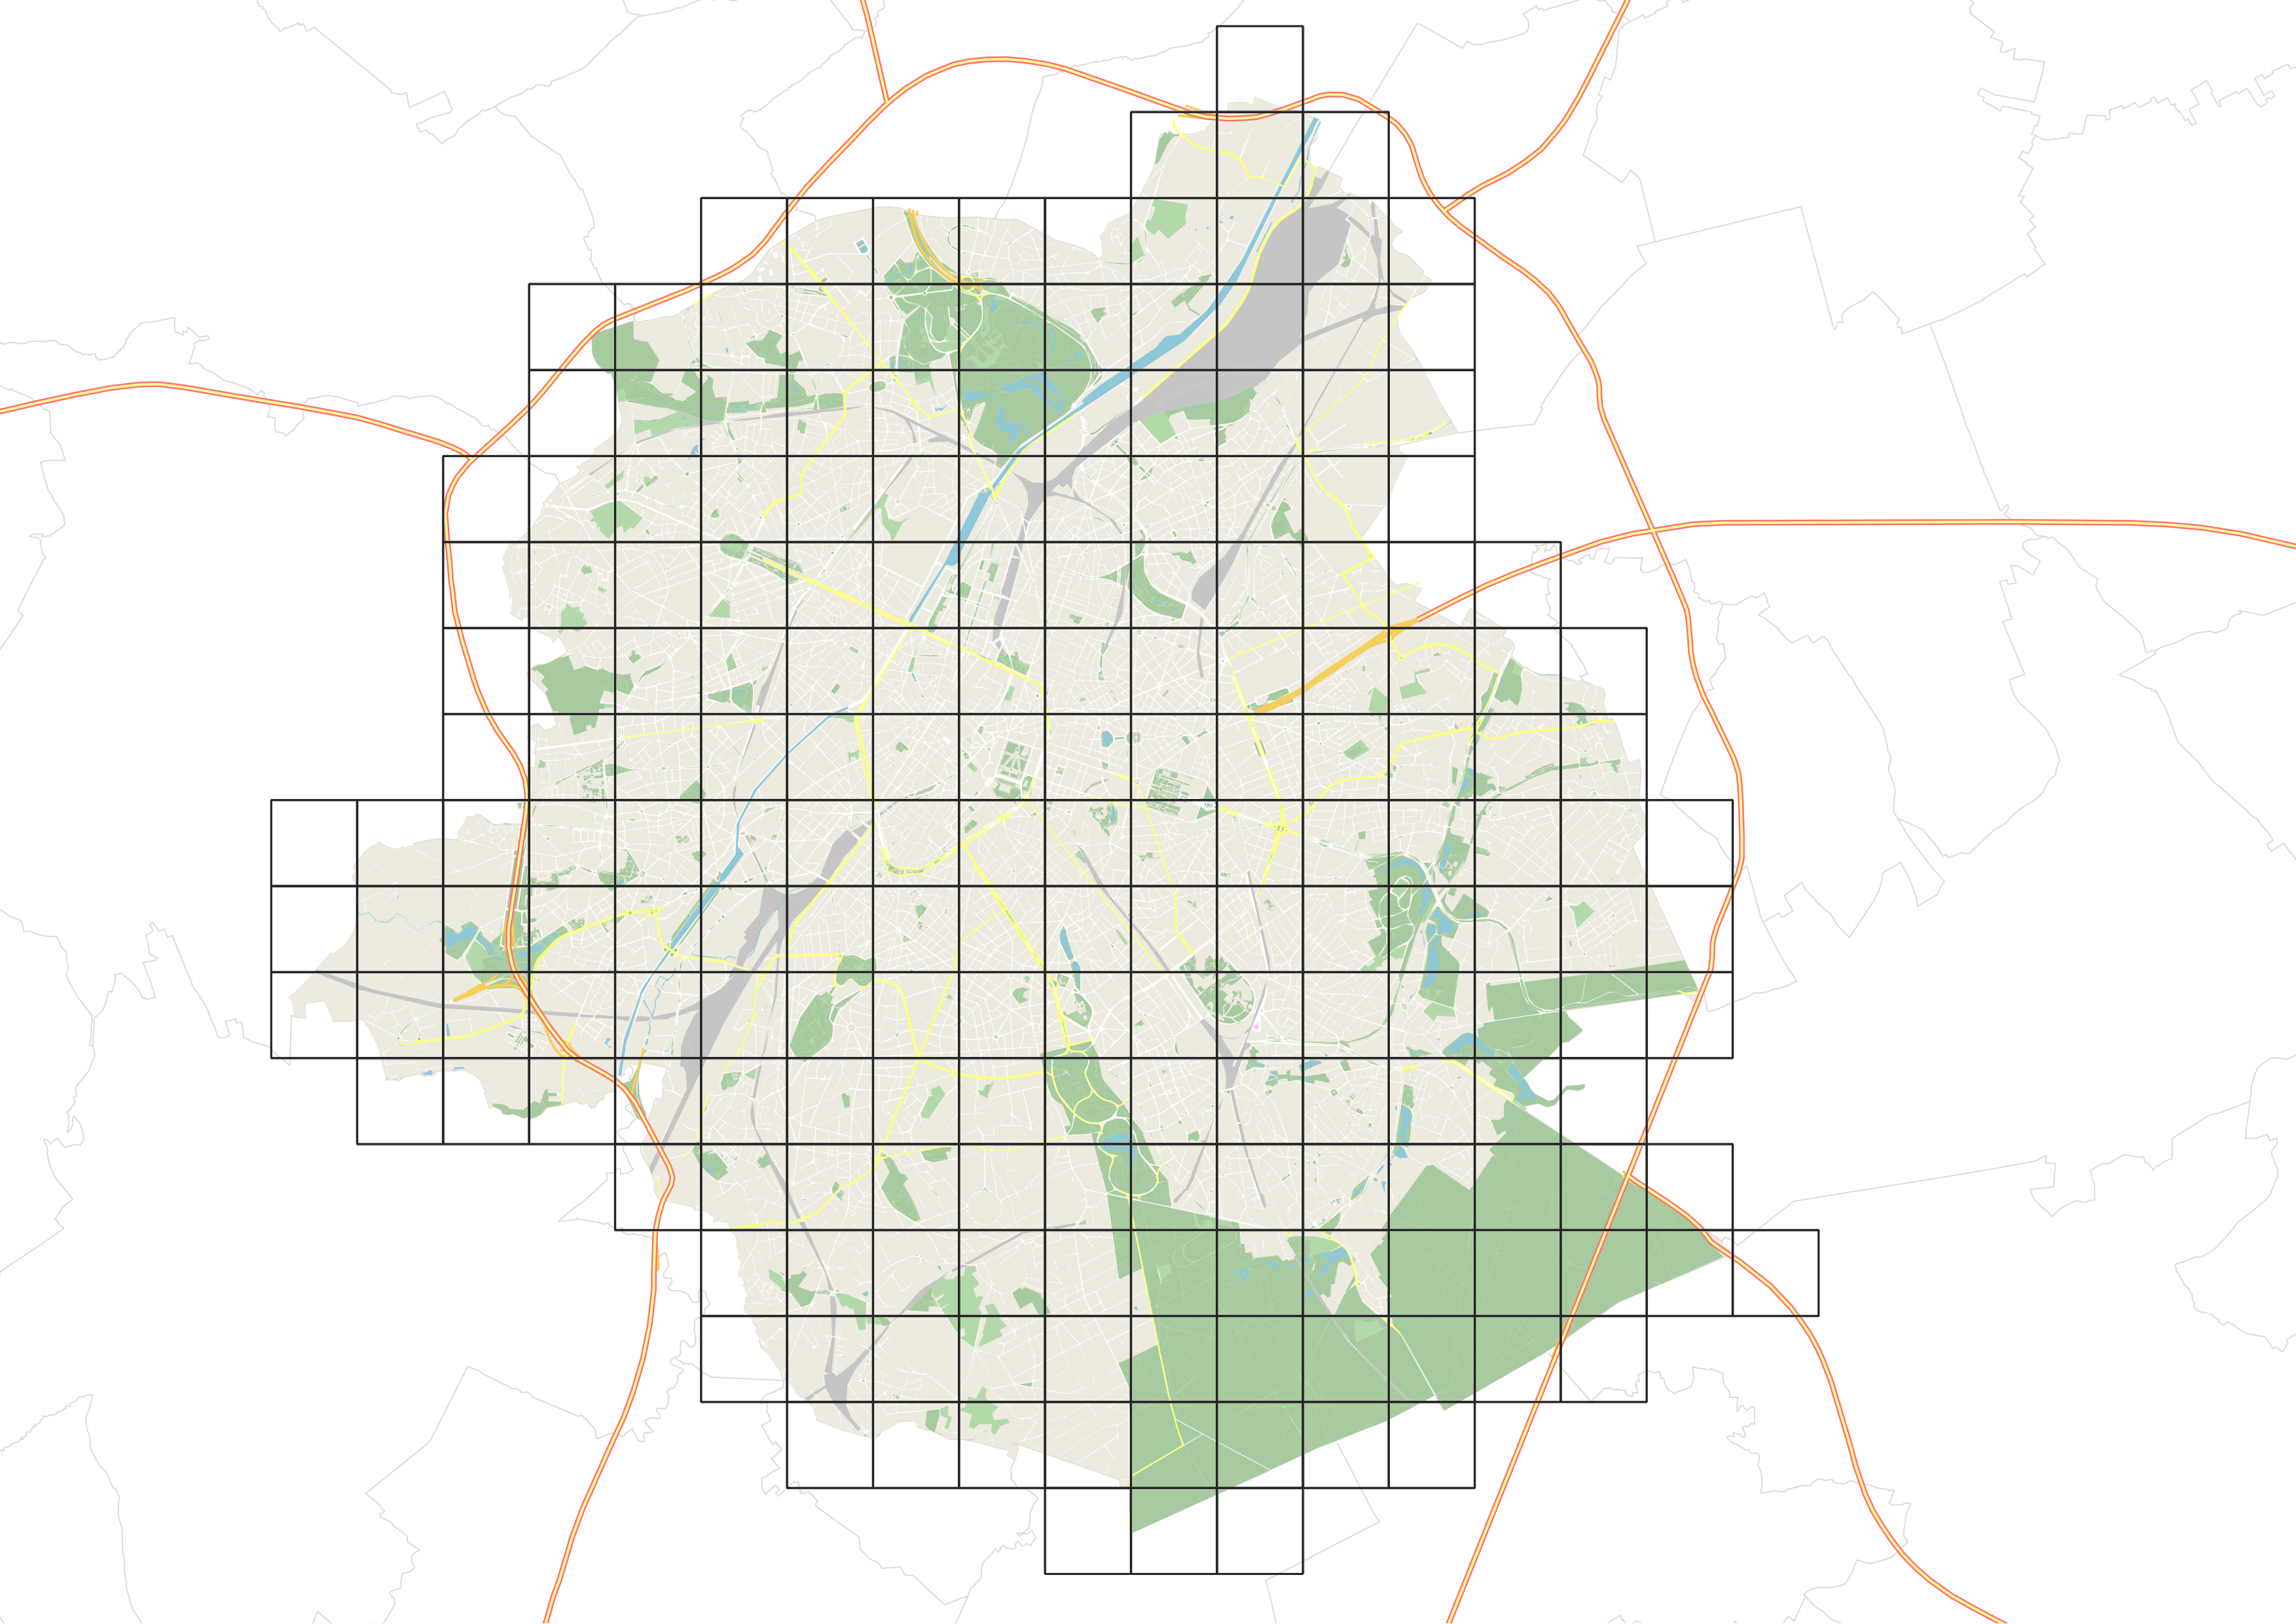
This dataset corresponds to the mesh delimiting the boxes (also called grids) used in UrbIS. The mesh covers the entire territory of the Brussels-Capital Region, and the boxes are one kilometer on each side.
 Geobru catalogue