 Geobru catalogue
2013
Type of resources
Available actions
Topics
INSPIRE themes
Keywords
Contact for the resource
Provided by
Years
Formats
Representation types
Update frequencies
status
Service types
Scale
Resolution
-
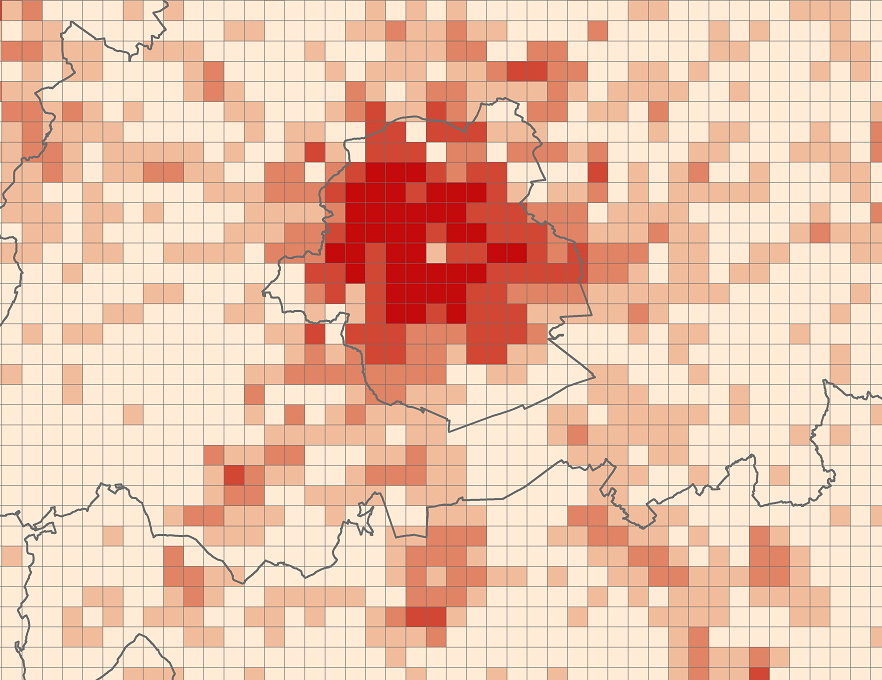
The files contain the population characteristics (total, gender and/or age groups) by 1 km² square grid cell in Belgium on January 1st, according to the European definition of the population. The European definition takes into account the 12-months criterion and includes asylum seekers. More information at https://ec.europa.eu/eurostat/cache/metadata/en/demo_pop_esms.htm#unit_measure1589188532500.
-

The "UrbIS - Contour lines" product represents the elevation of the Brussels region by means of contour lines with intervals of 0.5 metres. The dataset is freely downloadable as a zipped file.
-

The 2012 Triangulated irregular network (TIN) product is a mesh composed of irregular triangles. The dataset is freely downloadable as a zipped file.
-
Brussels-Capital Region : OGC:WMS service Urban for patrimonial protected sites
-
CartoWeb.be is a Web Service (WMTS/WMS) containing cartographic representations covering 11 scale levels. CartoWeb.be offers a cartographic representation which has been developed specifically for on-screen viewing of the NGI’s most recent vector data sets. Three versions are available for the Belgian territory: 1) a TOPO layer containing a cartographic representation at all scales; 2) a TOPO-GREY layer, which is the symbolisation in different shades of grey and blue of the TOPO layer. It constitutes an ideal map background; 3) an OVERLAY (1:2 500 - 1:25 000) layer destined to be used as an overlay on other data (orthophotographs for instance). This layer contains the symbolisation of a few layers only. Two other layers, CROSSBORDER and CROSSBORDER-GREY, are available in order to allow viewing (only on the smallest scales 1:100 000 – 1:4 000 000) the European context of Belgium. The extent of this representation is limited and could change in the following versions. It is best to combine the CROSSBORDER layer with the TOPO layer. It is best to combine the CROSSBORDER-GREY layer with the TOPO-GREY-layer.
-
Brussels-Capital Region : OGC:GML Download service Urban for patrimonial protected sites
-

Brussels-Capital Region : Brussels-Capital statistical areas are grouped to form the districts of monitoring. Monitoring the neighborhood is an urban observation tool to help track and understand the evolution of Brussels districts in different aspects (demographic, social, health, economy, housing, mobility, quality of life, participation, ... ) to improve the efficiency of urban policy and help guide public and private investment in urban renewal ...
-
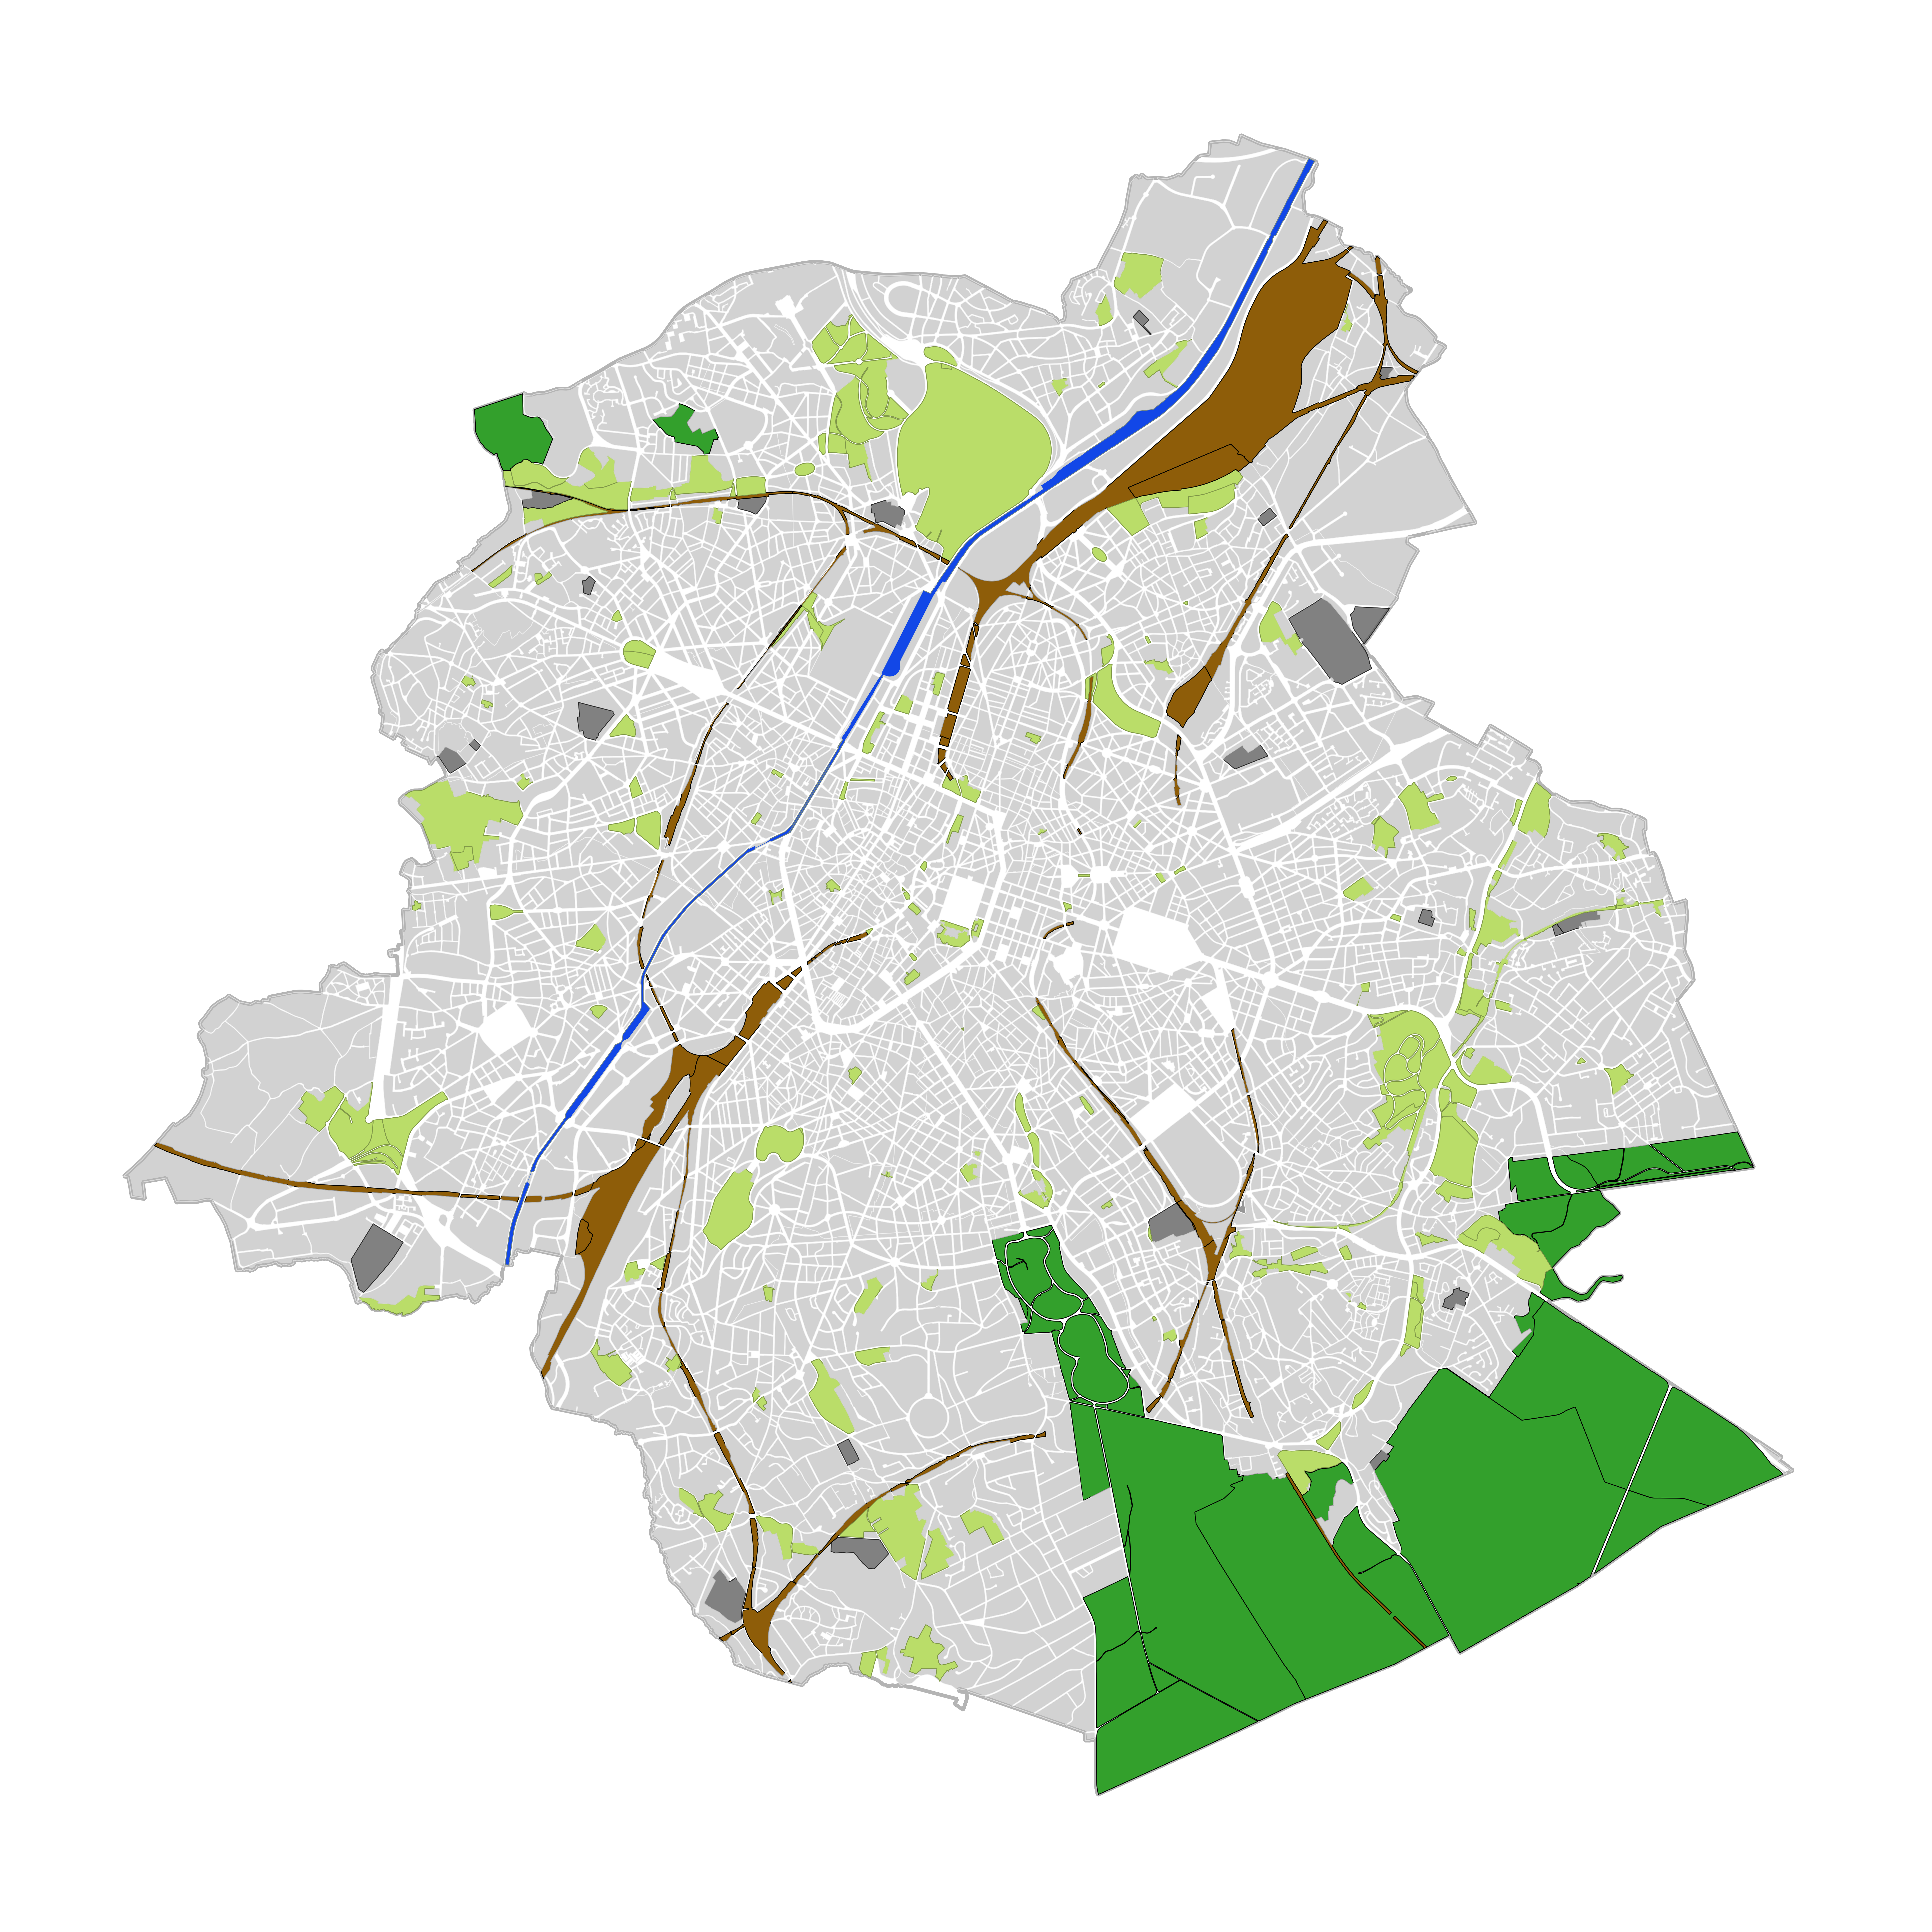
Brussels-Capital Region : land cover refers to the physical and biological cover of the earth's surface, including artificial surfaces, agricultural areas, forests, semi-natural areas, wetlands, water bodies. The entity "Green Block" (or green area) identifies the footprint of vegetated amenity areas(lawn, trees, possibly planted with flowers and ornamental trees and bushes, and often lined ponds and paths). Green areas have been designed on the basis of various plans (photogrammetric surveys, detailed maps, maps of towns, ...). They have a heterogeneous precision because of the diversity of origin. The entity "Green Block" (or green area) is represented using three different types: - GB-A: grassed (some grassy berm plants or trees) bands; - GB-B: parks (water parks located in these areas are not excluded); - GB-F: forests or wood (islets of the Soignes Forest located in the Brussels Region). The entity "Water Block" (or water area) locates and identifies various water bodies in the territory of the Brussels-Capital Region (channel, ponds, Senne river, ...). We distinguish : 1. water areas located at [0] which are visible from the air (abbreviated WB-0); 2. water areas (for the channel) located at [-] on the road (invisible from the sky) (abbreviated WB-M).
-
Brussels-Capital Region : In numerous Brussels neighbourhoods, the Brussels-Capital Region, in partnership with the municipalities, has made available land where the residents can develop a collective kitchen garden project. The initiative offers members the opportunity to inexpensively practise an outdoor activity and to obtain healthy food. The collective or individual kitchen garden is of course also the best way to eat fresh, local and seasonal fruits and vegetables, and thus to reduce the environmental impact of one’s food. The dataset resumes the name of the kitchen garden.
-

Brussels-Capital Region : building means any physical construction formed of rigid exterior walls, roofed, permanently attached to land, and designed to accommodate human activity and / or shelter for animals, goods and machinery.