 Geobru catalogue
Boundaries
Type of resources
Available actions
Topics
INSPIRE themes
Keywords
Contact for the resource
Provided by
Years
Formats
Representation types
Update frequencies
status
Scale
Resolution
-

This dataset includes the RGB & NI (Red, Green, Blue and Near-Infrared) orthophotos created in 2022. The images cover the entire Brussels Capital Region, with a resolution of 5 centimeters. The dataset is freely downloadable as a zipped file.
-

This dataset includes the RGB & NI (Red, Green, Blue and Near-Infrared) orthophotos created in 2022. The images cover the entire Brussels Capital Region, with a resolution of 5 centimeters. The dataset is freely downloadable as a zipped file.
-
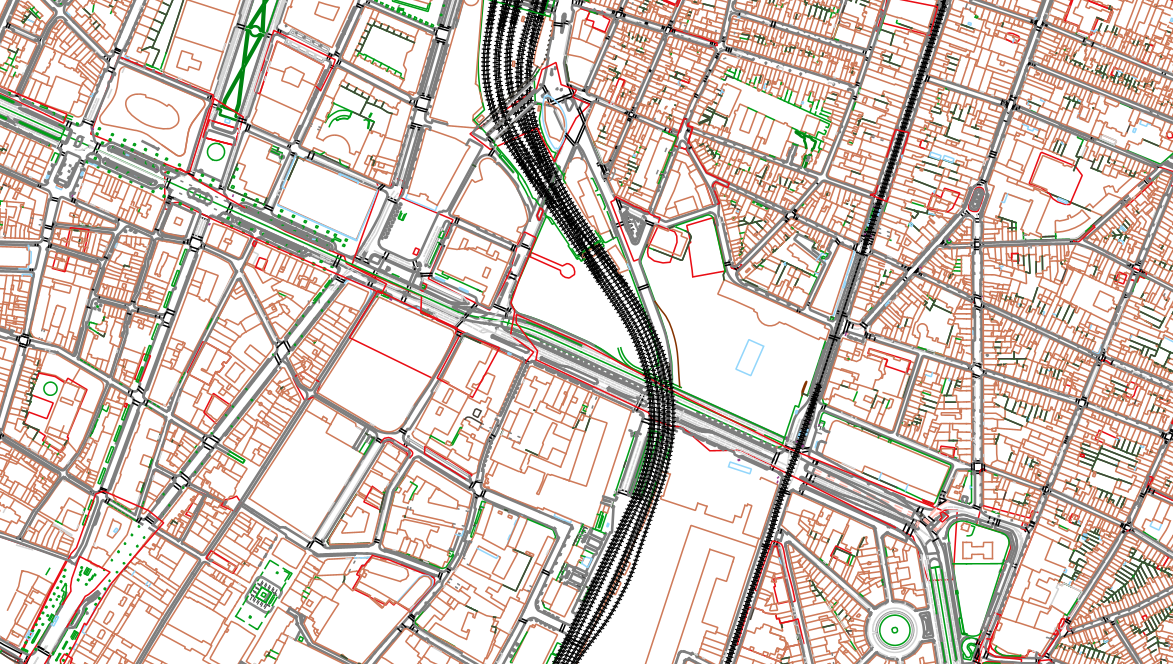
The UrbIS - Topo product is a catalogue of topographic geospatial vector data that contains geometric data, mainly lines, symbols and text. The product offers a digital representation of reality on a large scale through layers grouped by themes (e.g., buildings, roads, green spaces, etc.) and which can contain up to several tens of thousands of elements. The dataset is freely downloadable as a zipped file.
-
Administrative Units - INSPIRE corresponds to the dataset of the Belgian administrative units that complies with the INSPIRE specifications. This dataset is composed of two classes. The first class contains administrative units and the second class contains administrative boundaries. The class are composed of the following administrative level: Kingdom, Regions, Provinces, and arrondissements, and municipalities. The entire dataset can be downloaded via the ad hoc WFS.
-
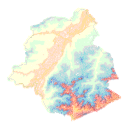
Brussels-Capital Region: Contour lines give an overview of the real ground on a topographic map. A contour line is the intersection of real terrain with a horizontal plane of given elevation. Contour lines are obtained from the Digital Terrain Model (DTM).
-
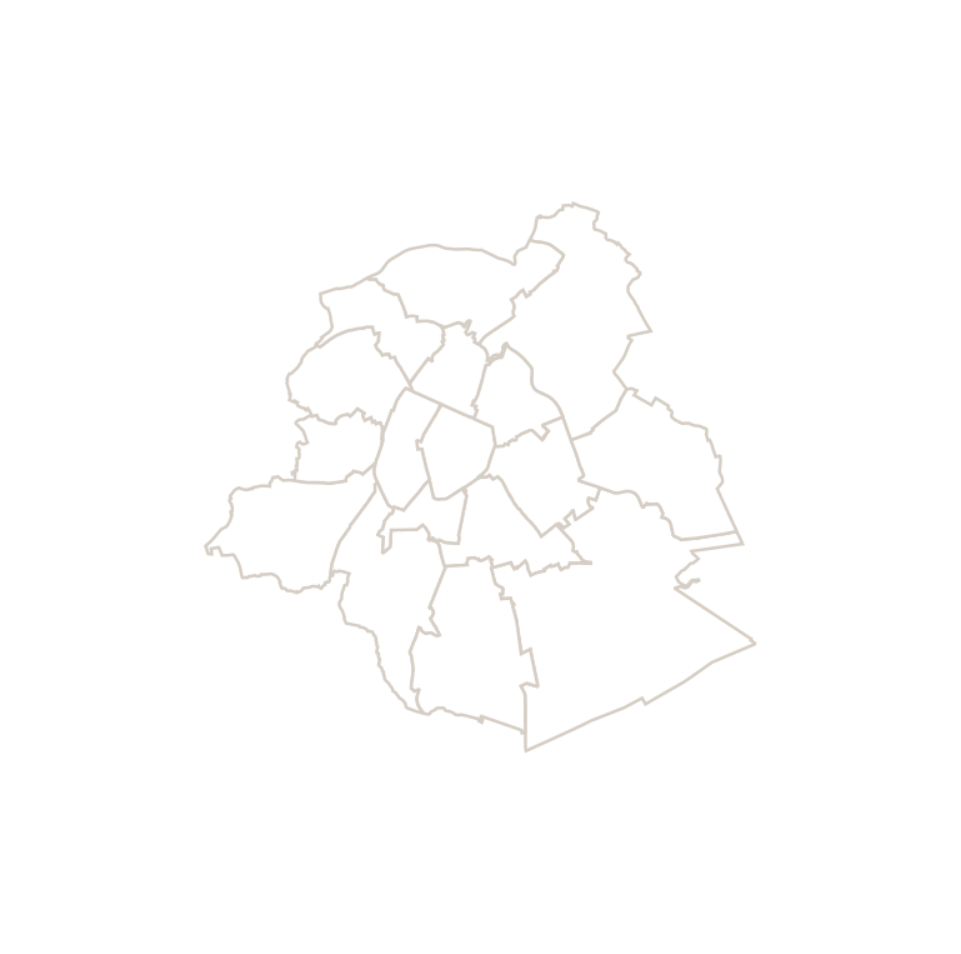
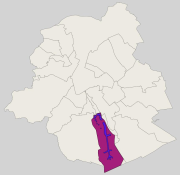
This dataset corresponds to the macrozone dataset, i.e. the highest-level statistical partition of the Brussels-Capital Region (the Region is divided into 17 macrozones).
-
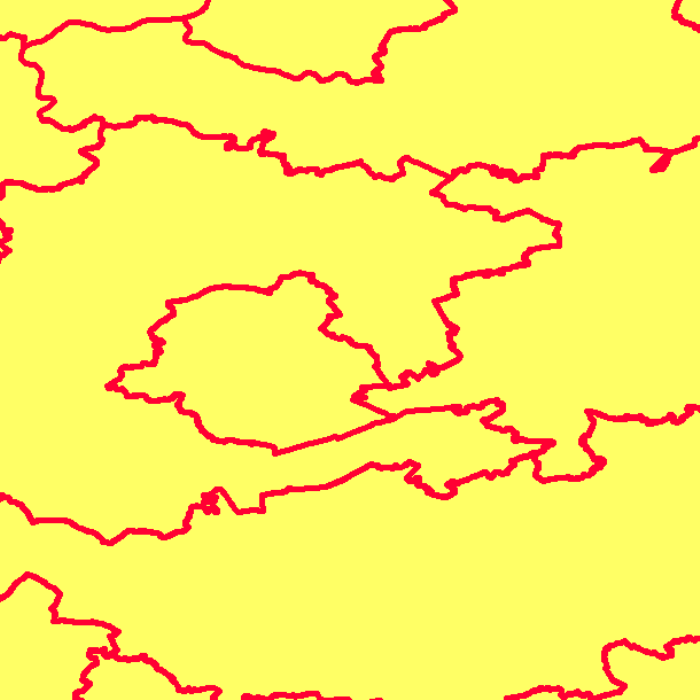
The data set presents in the form of polygons the breakdown of Belgium in almost 20,000 statistical sectors. The statistical sector is the basic territorial unit resulting from the subdivision of the territory of municipalities by STATBEL since 1970 for the dissemination of its statistics at a finer level than the municipal level. A statistical sector cannot extend over two municipalities and any point in the municipal territory is part of one and the same statistical sector. The 1970 and 1981 versions are shown in analogue format while the 2001, 2011, 2018, 2019 etc. versions are available in digital vector format. The files can be linked to the data on population, housing and disposable income on the website of Statbel.
-

Brussels-Capital Region : Brussels-Capital statistical areas are grouped to form the districts of monitoring. Monitoring the neighborhood is an urban observation tool to help track and understand the evolution of Brussels districts in different aspects (demographic, social, health, economy, housing, mobility, quality of life, participation, ... ) to improve the efficiency of urban policy and help guide public and private investment in urban renewal ...
-
This dataset corresponds to the groundwater catchments protection areas in the Brussels-Capital Region, in accordance with the decree of the Brussels-Capital Region Government of 19 September 2002 delimiting a groundwater catchments protection area in the Bois de la Cambre and the Forêt de Soignes. It is made of one geometric class: groundwater catchments protection areas.
-
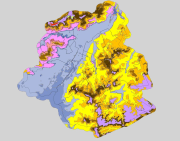
Brussels-Capital Region: spatial extents outcropping under the quaternary units of the Stratigraphic Units of the Brussels-Capital Region (SU/BCR). This data is limited to the Brussels-Capital Region’s border extended with a 500 m buffer zone. The hydrogeological unit (HU/BCR) of each SU/BRC is indicated in the attribute data. These spatial extents were extracted from the BruStrati3D v1.1 geological model. This data is generated from models and may contain errors, inaccuracies and gaps. It has informative value and may under no circumstances replace a study carried out by an expert. Bruxelles Environnement cannot be held liable for the consequences of the use of this information.