 Geobru catalogue
2018
Type of resources
Available actions
Topics
INSPIRE themes
Keywords
Contact for the resource
Provided by
Years
Formats
Representation types
Update frequencies
status
Service types
Scale
Resolution
-
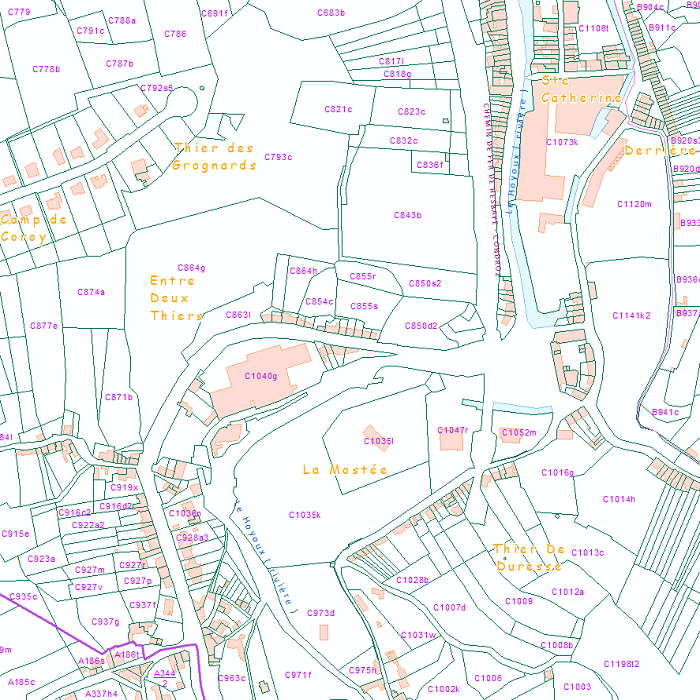
This web service provides the display of the datasets Administrative units - current situation and Land register plan - current situation. This webservice does not comply with the INSPIRE specifications, and the datasets to which it gives access do not comply with the INSPIRE specifications. This web service is available in several formats. It is recommended to use the PNG format.
-
This web service provides the download per object of the datasets Administrative units - current situation and Land register plan - current situation. This webservice does not comply with the INSPIRE specifications, and the datasets to which it gives access do not comply with the INSPIRE specifications.
-

This dataset includes the RGB (Red, Green, Blue) orthophotos created in 2018. The images cover the entire Brussels Capital Region, with a resolution of 5 centimeters.
-
This dataset corresponds to Black carbon concentrations in the Brussels-Capital Region. It is made of one geometric class.
-
This dataset corresponds to the low emission zone (LEZ) in the Brussels-Capital Region. It is made of two geometric classes : the boundaries of the low emission zone and the transit parkings (P+R) accessible to vehicles that do not meet LEZ access criteria
-
This dataset includes the RGB (Red, Green, Blue) orthophotos created in 2018. The images cover the entire Brussels Capital Region, with a resolution of 5 centimeters.
-
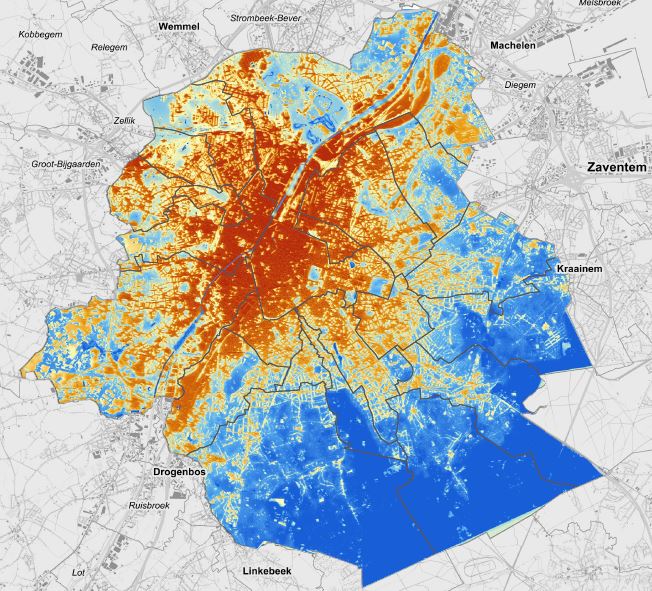
This dataset corresponds to urban heat islands. It 's made of a raster image with each pixel corresponding to a standardised Wet Bulb Globe Temperature (WBGT) indicator value from 0 to 100. This indicator measures heat stress based on temperature, humidity, wind, exposure to solar radiation and cloud cover for a typical hot summer day (i.e. 24 August 2016).
-
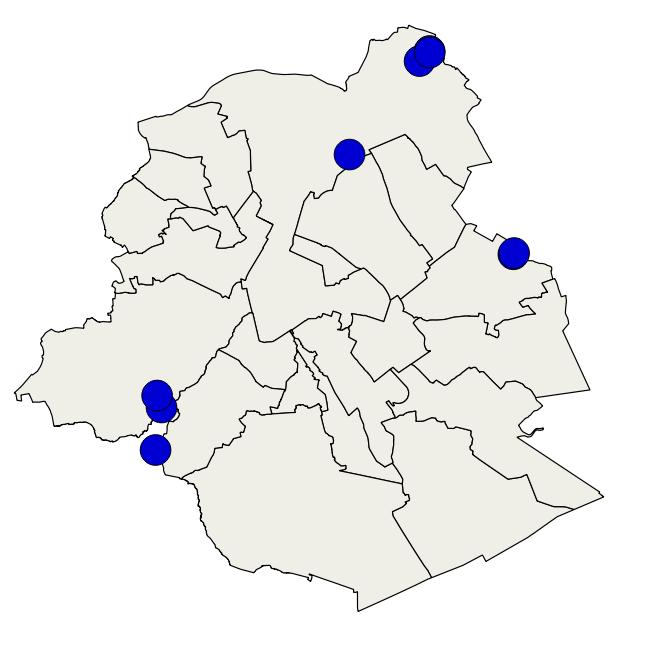
Brussels-Capital Region : location of the different surface water biological quality monitoring sites under the Water Framework Ordonnance and Directive. Surface waters concerned are surface water bodies: Canal, Senne and Woluwe. Monitoring involves a series of biological parameters.
-
WCS die de compilatie weergeeft van de meest recente middenschalige orthofotomozaïeken uit de wintervluchten die voor ieder deel van Vlaanderen beschikbaar zijn die wordt bijgewerkt telkens er een nieuw deel beschikbaar is. (OGC:WCS overdrachtservice)
-
Brussels-Capital Region: map of areas likely to be flooded (future events). Prepared in accordance with Article 4 of the European Flood Directive 2007/60/EC.