 Geobru catalogue
modelling
Type of resources
Available actions
Topics
INSPIRE themes
Keywords
Contact for the resource
Provided by
Formats
Representation types
Update frequencies
status
Scale
-
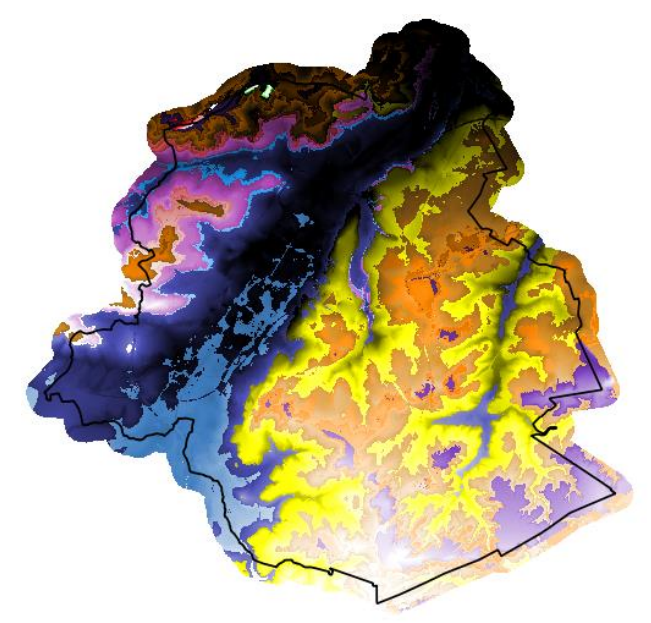
Brussels-Capital Region : The geological model BRUSTRATI3D v1.1 is a set of raster files covering the Brussels-Capital Region. These files contain the roof elevations and the thicknesses of the Stratigraphic Units (SU/BCR) and the Digital Terrain Model (DTM) of the topographic surface used in this model. These rasters have a 10x10m resolution and their reference coordinate system is EPSG 31370 (Belgian Lambert 31370). The documentation relating to the construction oh these data is available at the following addresses (French only): BRUSTRATI3D v1.1 https://document.environnement.brussels/opac_css/index.php?lvl=notice_display&id=10965 BRUSTRATI3D v1.0 https://document.environnement.brussels/opac_css/index.php?lvl=notice_display&id=10964 As the data in this archive is model-based, it may contain errors, inaccuracies and gaps. They should be used with caution and critical thinking. They can in no way replace a field study carried out by an expert. In general, Brussels Environment and the Geological Survey of Belgium cannot, under any circumstances, be held responsible for any damage, direct or indirect, resulting from the use of these data or the impossibility of using them for any reason whatsoever.
-
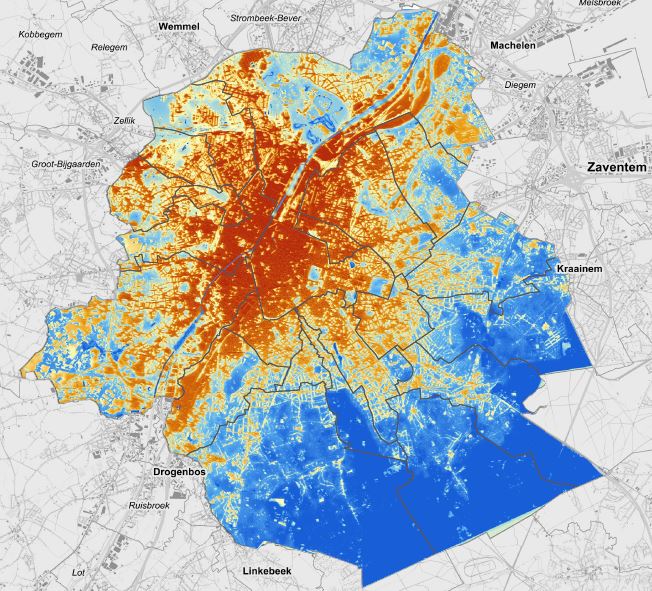
This dataset corresponds to urban heat islands. It 's made of a raster image with each pixel corresponding to a standardised Wet Bulb Globe Temperature (WBGT) indicator value from 0 to 100. This indicator measures heat stress based on temperature, humidity, wind, exposure to solar radiation and cloud cover for a typical hot summer day (i.e. 24 August 2016).
-

Brussels-Capital Region : Railway traffic noise register for the reference year 2021 (noise contours maps) for the Lden acoustic indicator (day-evening-night noise indicator). These maps are produced with an acoustic model in accordance with the prescriptions of the European directive 2002/49/EC.
-

Brussels-Capital Region : aircraft noise register for the reference year 2021 (noise contours maps) for the Ln acoustic indicator (night-time noise indicator). These maps are produced with an acoustic model in accordance with the prescriptions of the European directive 2002/49/EC
-

Brussels-Capital Region : Air traffic noise map for the reference year 2021 (noise contours maps) for the Lden acoustic indicator (day-evening-night noise indicator). These maps are produced with an acoustic model in accordance with the prescriptions of the European directive 2002/49/EC
-

Brussels-Capital Region : Road traffic noise register for the reference year 2021 (noise contours maps) for the Ln acoustic indicator (night-time noise indicator). These maps are produced with an acoustic model in accordance with the prescriptions of the European directive 2002/49/EC.
-

Brussels-Capital Region : Road traffic noise register for the reference year 2021 (noise contours maps) for the Lden acoustic indicator (day-evening-night noise indicator). These maps are produced with an acoustic model in accordance with the prescriptions of the European directive 2002/49/EC.
-

Brussels-Capital Region : Railway traffic noise register for the reference year 2021 (noise contours maps) for the Ln acoustic indicator (night-time noise indicator). These maps are produced with an acoustic model in accordance with the prescriptions of the European directive 2002/49/EC.
-
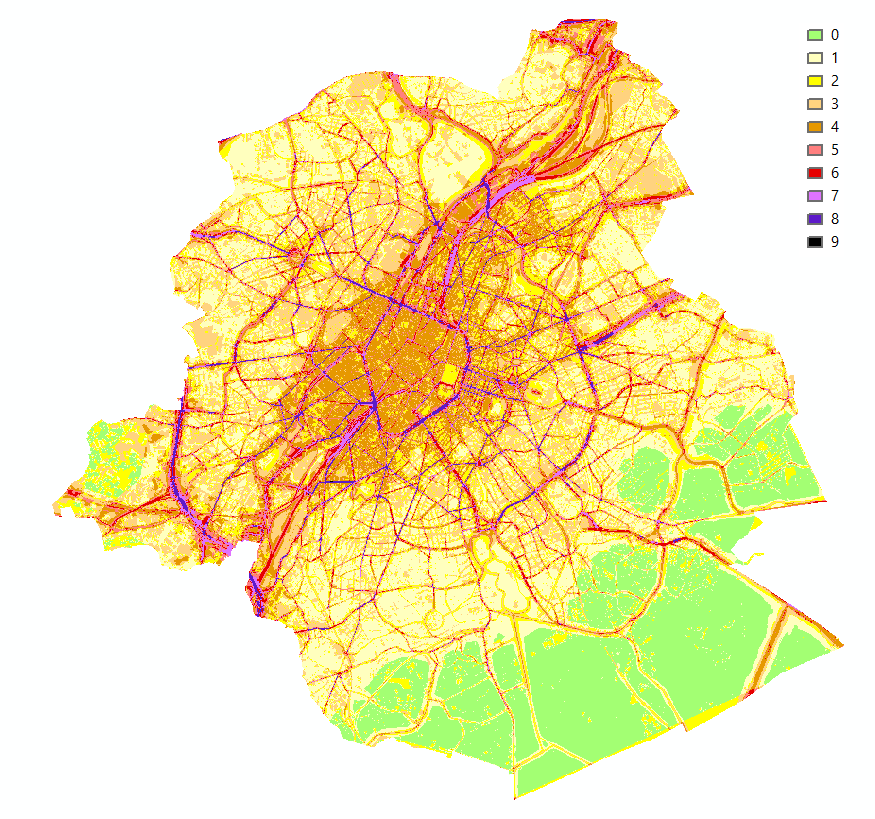
Brussels-Capital Region : This map shows the combined Health Impact Screening score for heat stress, air pollution and noise pollution (0-9) in the Brussels Capital Region. It was produced as part of the 2020 study on the "Impact of 'Nature-Based Solutions' (NBS) on urban residents' exposure to air pollution, noise pollution or high temperatures - Overview of general knowledge and recommendations for the Brussels-Capital Region". This map is a combination of 3 maps: heat stress (24/08/2016), air pollution (2018) and noise pollution (2016). For the methodology used, see p.54. The study report (in dutch) is available at http://document.environnement.brussels/opac_css/elecfile/NatureBasedSolutions
-
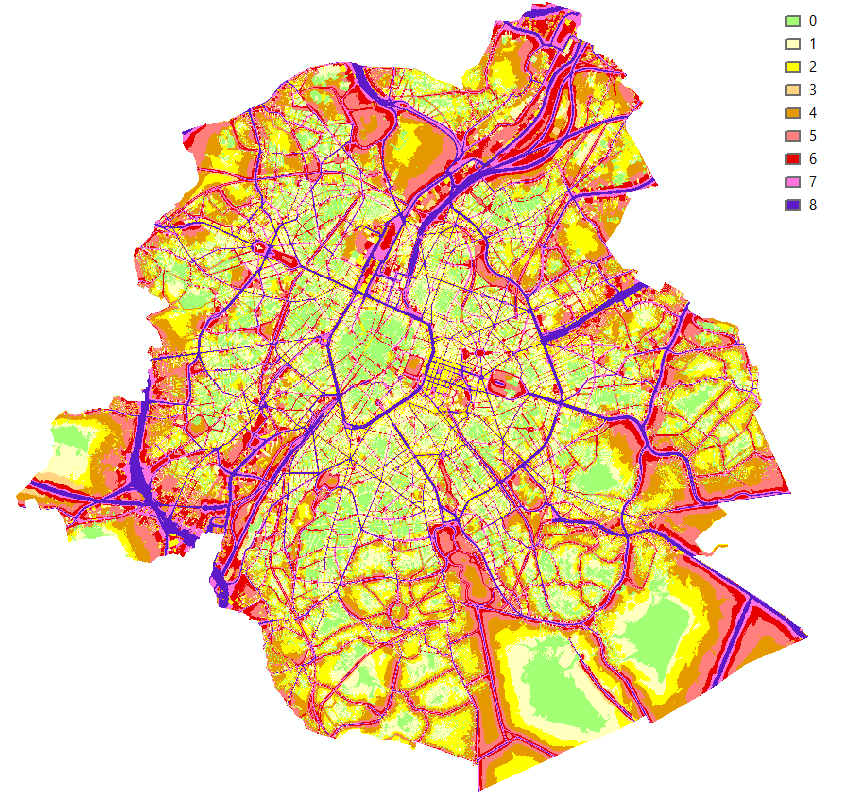
Brussels-Capital Region : This map shows the Health Impact Screening score for noise pollution (0-8) in the Brussels Capital Region. It was produced as part of the 2020 study on the "Impact of 'Nature-Based Solutions' (NBS) on urban residents' exposure to air pollution, noise pollution or high temperatures - Overview of general knowledge and recommendations for the Brussels-Capital Region". This map is based on the 2016 noise pollution maps for road traffic and rail traffic. For the methodology used, see p.51. The study report (in dutch) is available at http://document.environnement.brussels/opac_css/elecfile/NatureBasedSolutions